
You may have come across the work of the Dutch artist Maurits Cornelis Escher. His prints, woodcuts, and lithographs are filled with repeating patterns and impossible buildings, like staircases that seem to lead endlessly upwards, as in his print Ascending and Descending. In others, for example the famous Circle Limit prints, smaller and smaller figures fill a circular world without ever quite reaching its edge, which provides a visualisation of the geometry of the hyperbolic plane. Other works show intricate and accurate depictions of geometric shapes, like Archimedean solids and other regular polytopes. An overarching theme which makes Escher’s images so recognisable is thus that the ideas behind them often have deep connections to mathematics.
Escher was born in Leeuwarden in 1898 and trained as a graphic artist, rather than a mathematician. He studied in Haarlem, under the printmaker Samuel Jessurun de Mesquita, and then spent many years travelling and living in Italy. During his time in the Mediterranean, he visited the Alhambra in Granada, whose walls are covered with intricate geometric tilings. This helped inspire his long interest in repeating patterns that can cover a surface without leaving gaps, a concept which underlies many of his creations. Later in his career, Escher began corresponding with mathematicians, including H. S. M. Coxeter, who made important contributions to geometry. Through these exchanges, he encountered ideas related to symmetry, infinity, polytopes, and hyperbolic geometry. If you are interested in learning more about these correspondences, you can take a look at the book The world of M.C. Escher Besides many beautiful images, it also contains an extensive catalogue of Escher’s artworks, sketches, and studies. What is maybe surprising is that Escher himself usually approached complex ideas visually and intuitively, rather than with formal mathematics. He experimented with sketches, grids, and carefully constructed transformations, rather than starting from equations. Coxeter was particularly impressed by the accuracy of Escher’s Circle Limit prints, which represented patterns in the so-called Poincaré disc representation of hyperbolic space. He admired that Escher had achieved this geometry largely through intuition, without having undergone notable formal or academic training in mathematics.
1) A mind-bending artwork
In this article, however, we will focus on a less immediately famous, yet especially intriguing work: Escher’s 1956 lithograph Print Gallery, or Prentententoonstelling in Dutch. The depicted scene is mind-bending: On the left, a young man is standing in an art exhibition gallery, looking at a print hanging on the wall. The print shows a Mediterranean port, with a row of buildings stretching along the waterfront. However, as one follows the building fronts around the picture, something strange happens: they grow larger and warp around the centre of the image. The strangest thing is that one of those buildings turns out to be a shrunken-down and rotated version of the very same gallery in which the young man is standing. The animation below from the YouTube channel EscherGranada makes this hidden repetition visible. It allows us to zoom continuously into the picture, passing through smaller and rotated versions of the same scene.
This is an example of self-reference: an image containing a scaled or rotated copy of itself. It is often called the Droste effect, after the old packaging of the Dutch cocoa brand Droste.[2] The box showed a nurse carrying a tray with another box on it, which carried the same image again, and so on. Escher’s version is, however, significantly more complicated to wrap one’s head around. The reason is that the repeated motif is not simply made smaller, but also rotated and strongly distorted, thus producing the spiral-like movement running through the lithograph. As you travel around the centre, the gallery gradually turns into the town, which then curves back again to warp into the gallery. In principle, moving further inwards should reveal another smaller and rotated version of the entire scene, followed by another, and another.
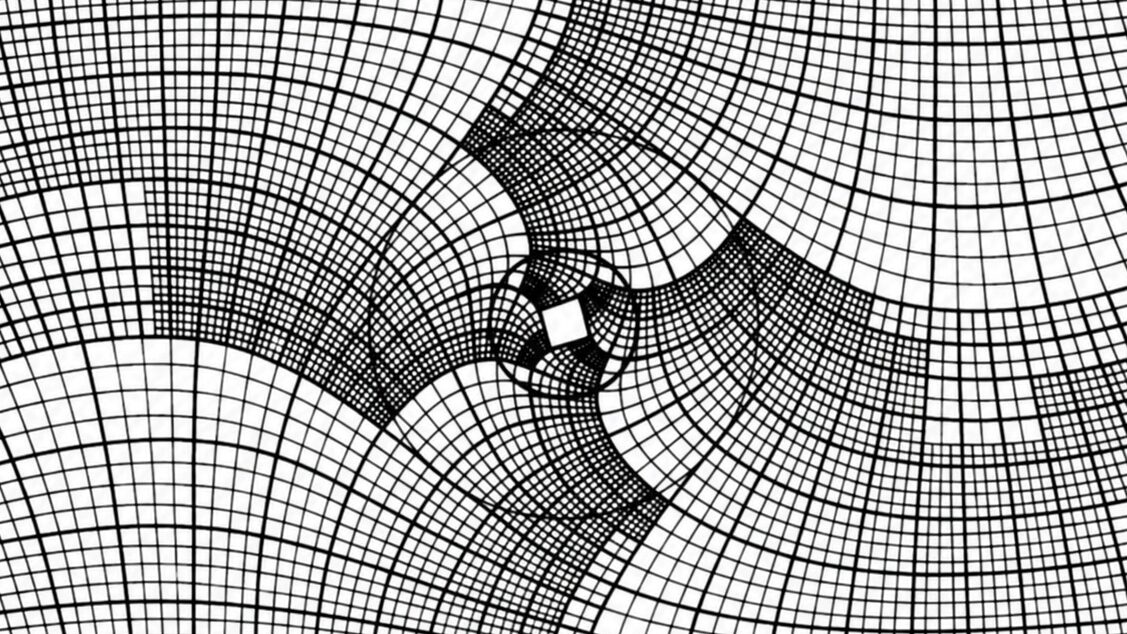
One thing to note about Print Gallery is that it is interesting that we can watch such a complete animation nowadays. At the centre of Escher’s original lithograph, one can see a circular white patch containing his signature. Remarkably, this was not simply an empty space intended as part of the motif. To continue the image consistently, Escher would have had to fit increasingly small, rotated and distorted copies of the scene into the centre. He may have been unsure how to continue the construction, or he may simply have chosen not to embark on such a tedious task. The infinite zoom shown in the video above was therefore not completely drawn by Escher himself. About half a century later, researchers could finally work out exactly what Escher’s construction implied and how to continue the picture into the empty centre.
2) The mathematics behind Print Gallery
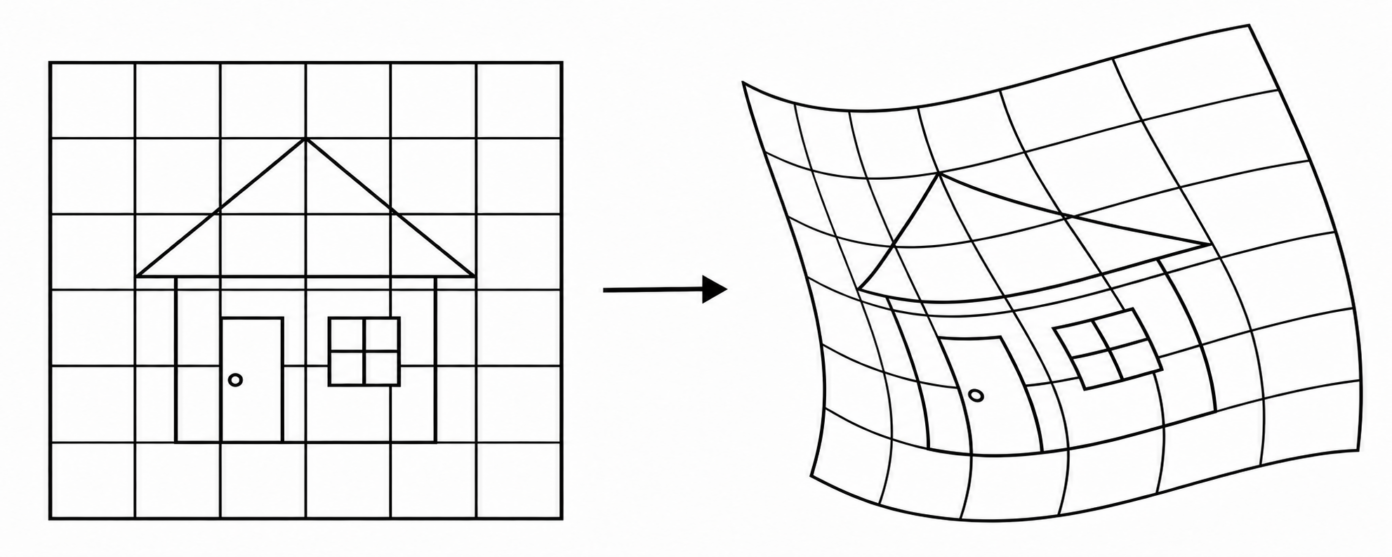
How did Escher produce such a complicated distortion without formal mathematics or modern image-processing software? His basic tool was deceptively simple: a grid. To realise the self-repeating pattern, Escher wanted to create a “cyclic expansion”, a picture in which the scale changes continuously as the eye travels around the centre. Imagine following a closed path through a grid and finding that every cell becomes a little larger than the previous one. After making a complete round, you arrive back where you started, except that the grid has now become much larger. Because the beginning and end of the path join together, there is no obvious point at which the expansion starts or stops. This principle also underlies the depiction of the Droste packaging, but there we only move inwards or outwards, not in circles, as well. Escher first tried to construct the effect he was after using a grid of straight lines. Such a grid can then already be used to enlarge or shrink a drawing. You can place an ordinary square grid over the original image and give every square a matching cell in the expanding grid. The contents of each ordinary square are then copied into the corresponding enlarged, compressed or distorted cell.
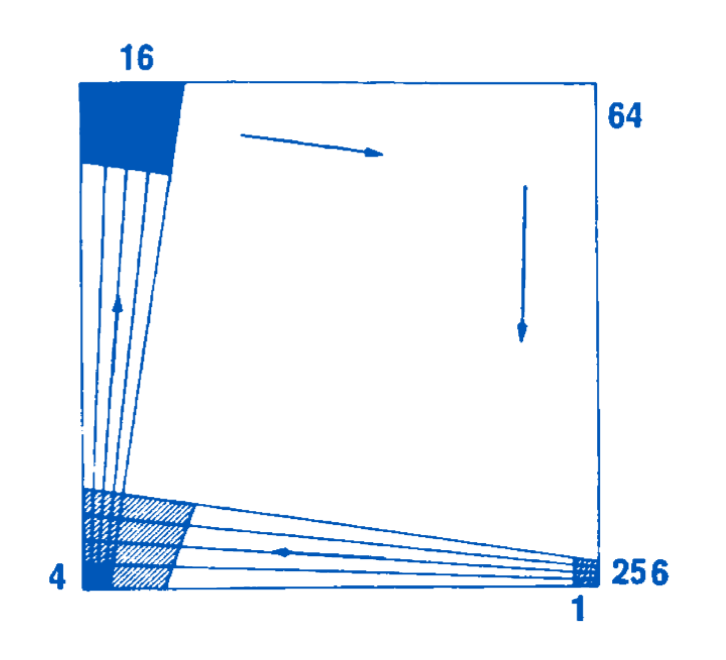
Escher’s final curved grid on which Print Gallery was designed still has the unusual scaling rule described above. As we move from one quarter of the picture to the next, the linear size of its cells increases by a factor of four. A square that is four times wider and four times taller could therefore be divided into a 4×4 array of cells of the previous size. The same change takes place in each of the four quarters. After one complete circuit around the centre, the total enlargement is therefore 44=256. The grid then folds back onto itself, but at 256 times the original linear scale. This is the central trick behind the picture: one trip around the centre also carries us from one level of the image to another [3].
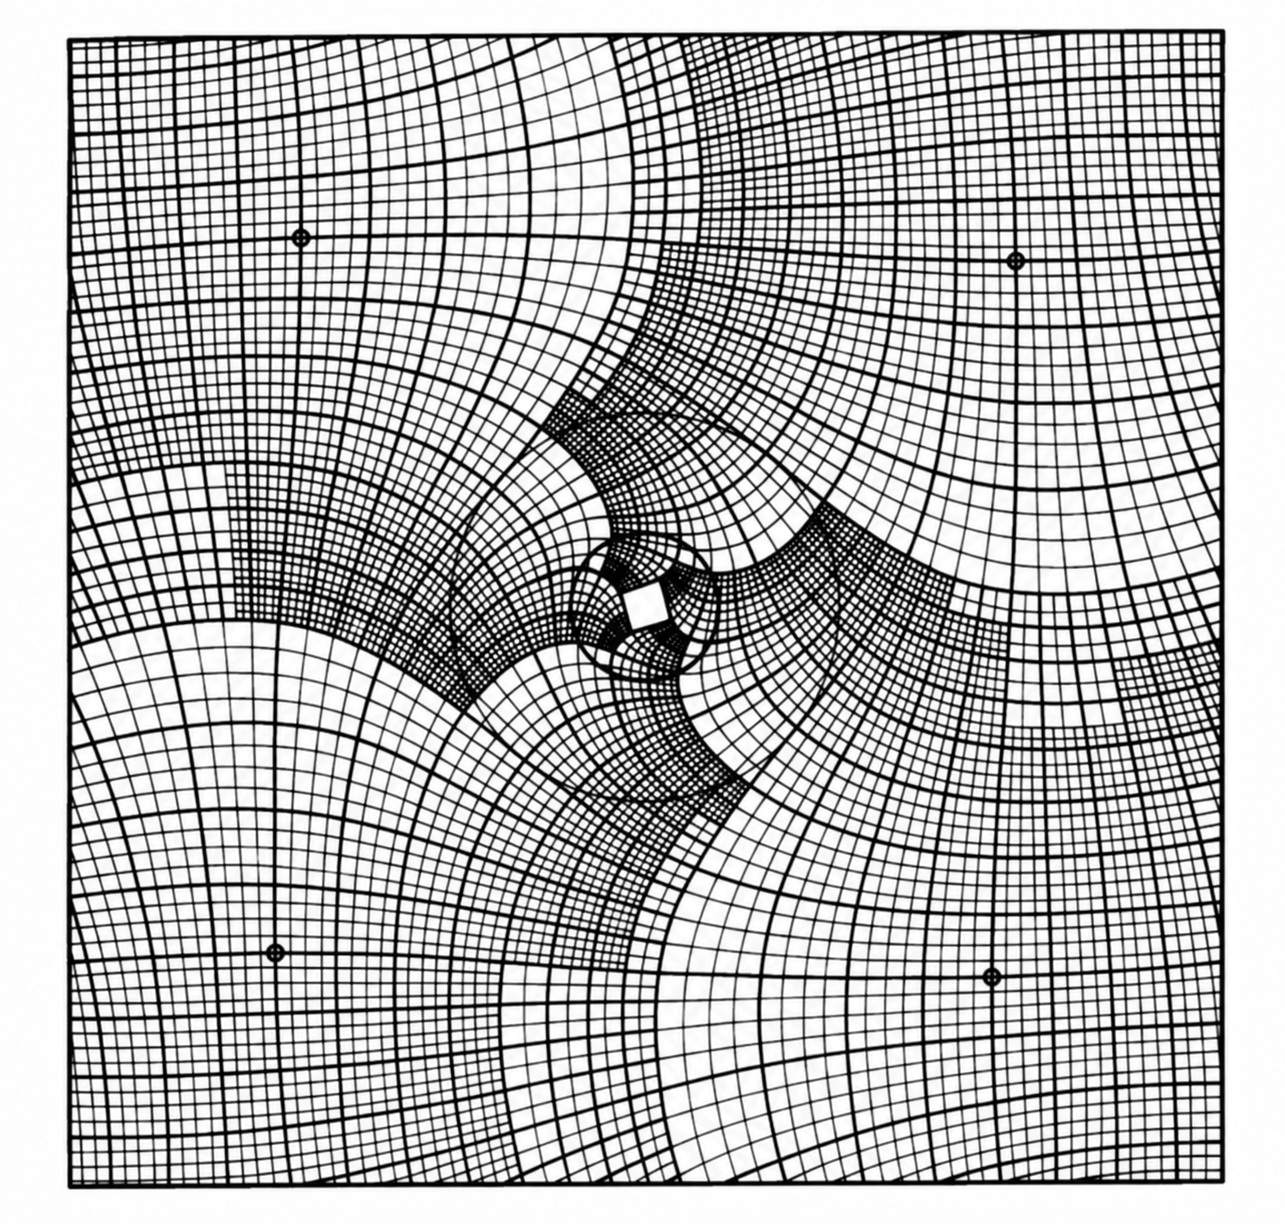
The process required an extraordinary amount of preparation: Escher made at least four separate studies, corresponding to the four corners of the final lithograph, because different parts of the scene required different levels of detail. Each study included part of the preceding one, enlarged by a factor of four. Taken together, the four studies behave like one enormous drawing that repeats whenever it is enlarged by a factor of 256. Some of these preparatory studies are reproduced in [1]. They show how Escher worked out the positions of individual windows, walls, and other architectural details before transferring them to the curved grid. It is perhaps unsurprising that the construction allegedly gave Escher “some almighty headaches” [3].
3) A lucky discovery
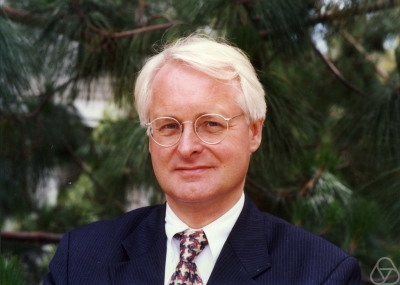
The idea leading to the crucial breakthrough came from the Dutch mathematician Hendrik Lenstra. Around the year 2000, Lenstra was on a plane from New Jersey to Amsterdam, when he came across a reproduction of Print Gallery in an in-flight magazine. The white patch caught his attention, as he pondered whether it was hiding a mathematical problem: could the lines of the picture be continued consistently into the centre? During the flight, he began thinking about the transformation that Escher might have used. Lenstra recognised that the picture could be understood as a twisted version of the Droste effect. The story is recounted in a 2002 article published in SIAM News.
After returning to the Netherlands, Lenstra studied Escher’s preparatory grids and worked out the mathematical structure behind the distortion. His breakthrough showed that the white region could, in principle, be filled with further copies of the scene. However, turning that result into an actual image required much more than a formula. Lenstra’s Leiden colleague Bart de Smit took charge of the project that converted the mathematics into a digital reconstruction. Working with mathematics and computer-science student Joost Batenburg, as well as the Dutch artists Jacqueline Hofstra, Hans Richter, and several other contributors, De Smit coordinated the process of straightening Escher’s distorted image, reconstructing the missing parts and transforming it back into its spiral form. Batenburg wrote the program that could undo Escher’s distortion cell by cell, producing four straightened versions of the scene. Hans Richter then redrew these images and corrected their perspective, while Jacqueline Hofstra added the grayscale needed to join them into a continuous pattern. After roughly two years of mathematical, computational, and artistic work, the team produced the completed version of Print Gallery and the continuous zoom shown below. Lenstra and De Smit later presented the mathematics behind the reconstruction in [3], a joint article for the American Mathematical Society.
Escher performed his transformation by hand. Lenstra and De Smit approached it differently: they translated the picture into the language of complex numbers. A complex number can be written in the form \( z=x+iy \), where \( i \) is the imaginary number that squares to \( -1 \). For our purposes, you can think of \( x \) and \( y \) as simply the horizontal and vertical coordinates of a point in the image. Complex numbers are especially convenient here because multiplication can describe both a change of size, due to scaling, and a rotation at the same time. We can now imagine the undistorted picture as a function \( f(z) \). For every position \( z \) in the complex plane, which is “superimposed” on the image, the function tells us which colour to place there. In the case of Escher’s simplified black-and-white model, \( f(z) \) takes one of two values: black or white. In their reconstruction, Lenstra and De Smit treated the geometry of the grid and the shading as separate stages. They first transformed the reconstructed drawing into a straightened, doubly periodic picture on the complex plane. Artists then added grayscale shading to this straightened version. Eventually, the conformal transformations were applied to carry the shaded image back into the curved geometry. The straightened version of Escher’s scene repeats when it is enlarged by a factor of 256. Mathematically, this can be expressed in terms of the invariance condition f(256z)=f(z). Mathematicians can express this by treating such points as equivalent, producing what is called a quotient group [2]. The straightened picture is described by a group known as \( \mathbb{C}^{*}/256^{\mathbb{Z}} \), while the idealised curved picture has a similar quotient in which each repetition includes both scaling and rotation. The conformal transformation provides the connection between these two descriptions.
Note that the equations above do not say that the points \( z \) and \( 256z \) occupy the same position. Instead, they sit at equivalent points of the repeating picture. If we move 256 times farther from the centre, we encounter the same image again at a different scale. This phenomenon is known as scale invariance and crucially underlies, for instance, the study of phase transitions in physics.
The next step for Lenstra and his collaborators was to find a conformal transformation mapping the straight, scale-repeating picture onto Escher’s curved world. Because the transformation preserves local angles, it can bend the large-scale scene without shearing its smallest details too badly. This is the formal version of what Escher had been trying to achieve when he adjusted his grid so that its cells continued to look like squares. One more mathematical tool can make the problem easier. Taking the logarithm of the coordinates “unwraps” the scaling. In mathematical terms, \( \log(256z)=\log(z)+\log(256) \) (to be precise: up to multiples of \( 2 \pi i \) because complex logarithms are multivalued), whereby repeatedly multiplying the scale by 256 becomes an ordinary sideways shift in logarithmic coordinates. Scaling has therefore been converted into translation. A picture that seemed to spiral endlessly into itself can therefore be turned into something more like a repeating wallpaper pattern.
The researchers could straighten the image, repair and complete the repeating scene, and then use the reverse transformation, i.e., the exponential function, to wrap it back into its curved form. The complete calculation is rather involved and uses the theory of elliptic curves, but the central idea is clear: convert scaling and rotation into ordinary repetition, complete the repeated pattern, and finally transform it back. In the final curved image, moving inward from one complete copy to the next reduces the picture by a factor of about 22.6 and rotates it clockwise by roughly 157.6 degrees. Those precise values were not chosen by hand; they follow from the requirement that the straight and curved versions fit together conformally. This gave Lenstra and De Smit a mathematical rule for continuing the picture into the white region. The Leiden team then used Escher’s grid, computer programs, and newly drawn material to produce the completed image [3]. One final point is worth clarifying: the numbers 256 and 22.6 both describe the periods of the same repeating structure, but in two different versions of the picture. In Escher’s straightened studies, completing one full cycle brings us back to the same scene enlarged by a factor of 256. After the picture is transformed into its curved form, this pure enlargement becomes a combination of scaling and rotation: each copy contains another copy approximately 22.6 times smaller and rotated clockwise by about 157.6 degrees. The two results therefore describe the same repetition, one in the straight grid and one in Escher’s curved world.
Conclusion
When he created Print Gallery, Escher began with a fairly simple question: could a picture grow as you followed it around and eventually lead back into itself? Using his hand-drawn grids, he managed to turn the gallery, the harbour, and the viewer into one continuous loop, although he had to leave its centre blank. Almost fifty years later, Lenstra recognised the structure as a twisted version of the Droste effect, and De Smit and the Leiden team used mathematics and computers to continue it. In this case, the artistic idea came first and the equations followed much later. Thus, the story behind this fascinating lithograph serves as a reminder of how mathematics and art are often intertwined.
—
There is a museum devoted to M.C. Escher’s work in The Hague: Escher in The Palace. If this article has made you curious to see his prints up close, a visit might be just the thing for a rainy autumn weekend.
References
[1] J. L. Locher (ed.), The World of M. C. Escher. New York: Harry N. Abrams, 1971. ISBN 0-8109-0107-2. WorldCat record.
[2] Conrad, Keith. Applying Quotient Groups to an Unsolved Problem in Art. University of Connecticut, n.d. https://kconrad.math.uconn.edu/blurbs/grouptheory/CstarqZ.pdf.
[3] de Smit, B.; Lenstra, H. W. (2003). “The Mathematical Structure of Escher’s Print Gallery”. Notices of the American Mathematical Society. 50 (4): 446–451.